All Images
Using spreadsheet programs for data organisation
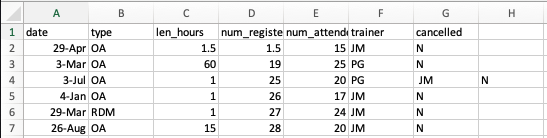
Formatting data tables in Spreadsheets
Figure 1
Figure 2
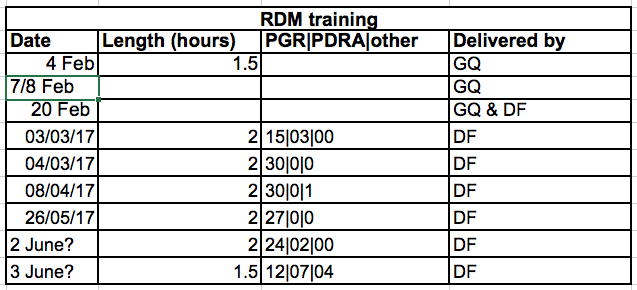
Figure 3
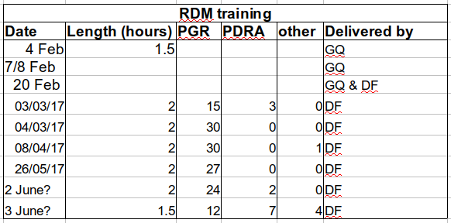
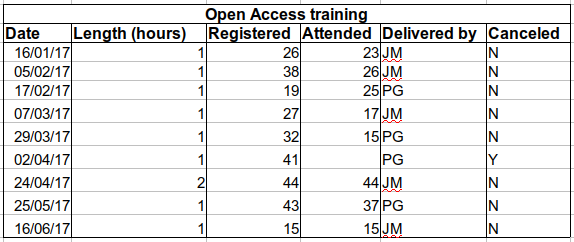
Formatting problems
Figure 1
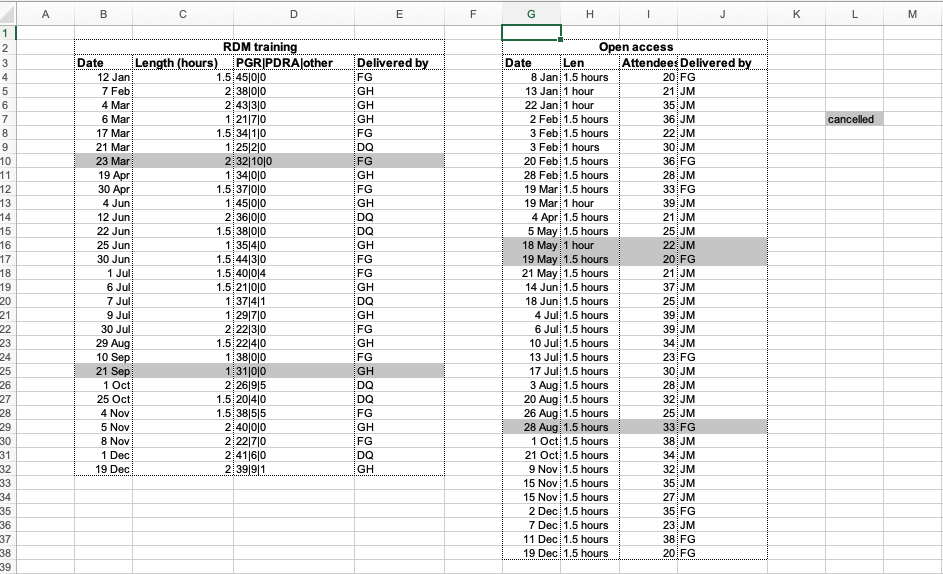
Figure 2
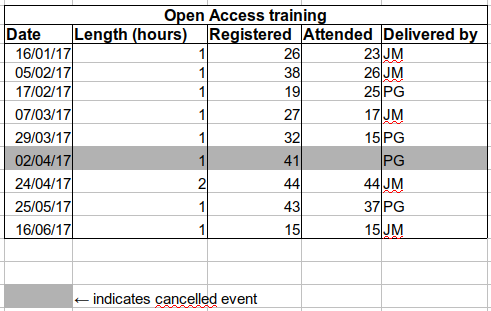
Figure 3
Dates as data
Figure 1
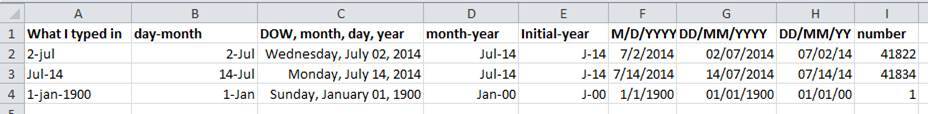
Figure 2
You can see that even though you wanted the year to be 2015 for all
entries, your spreadsheet program interpreted two entries as 2017, the
year the data was entered, not the year of the workshop. 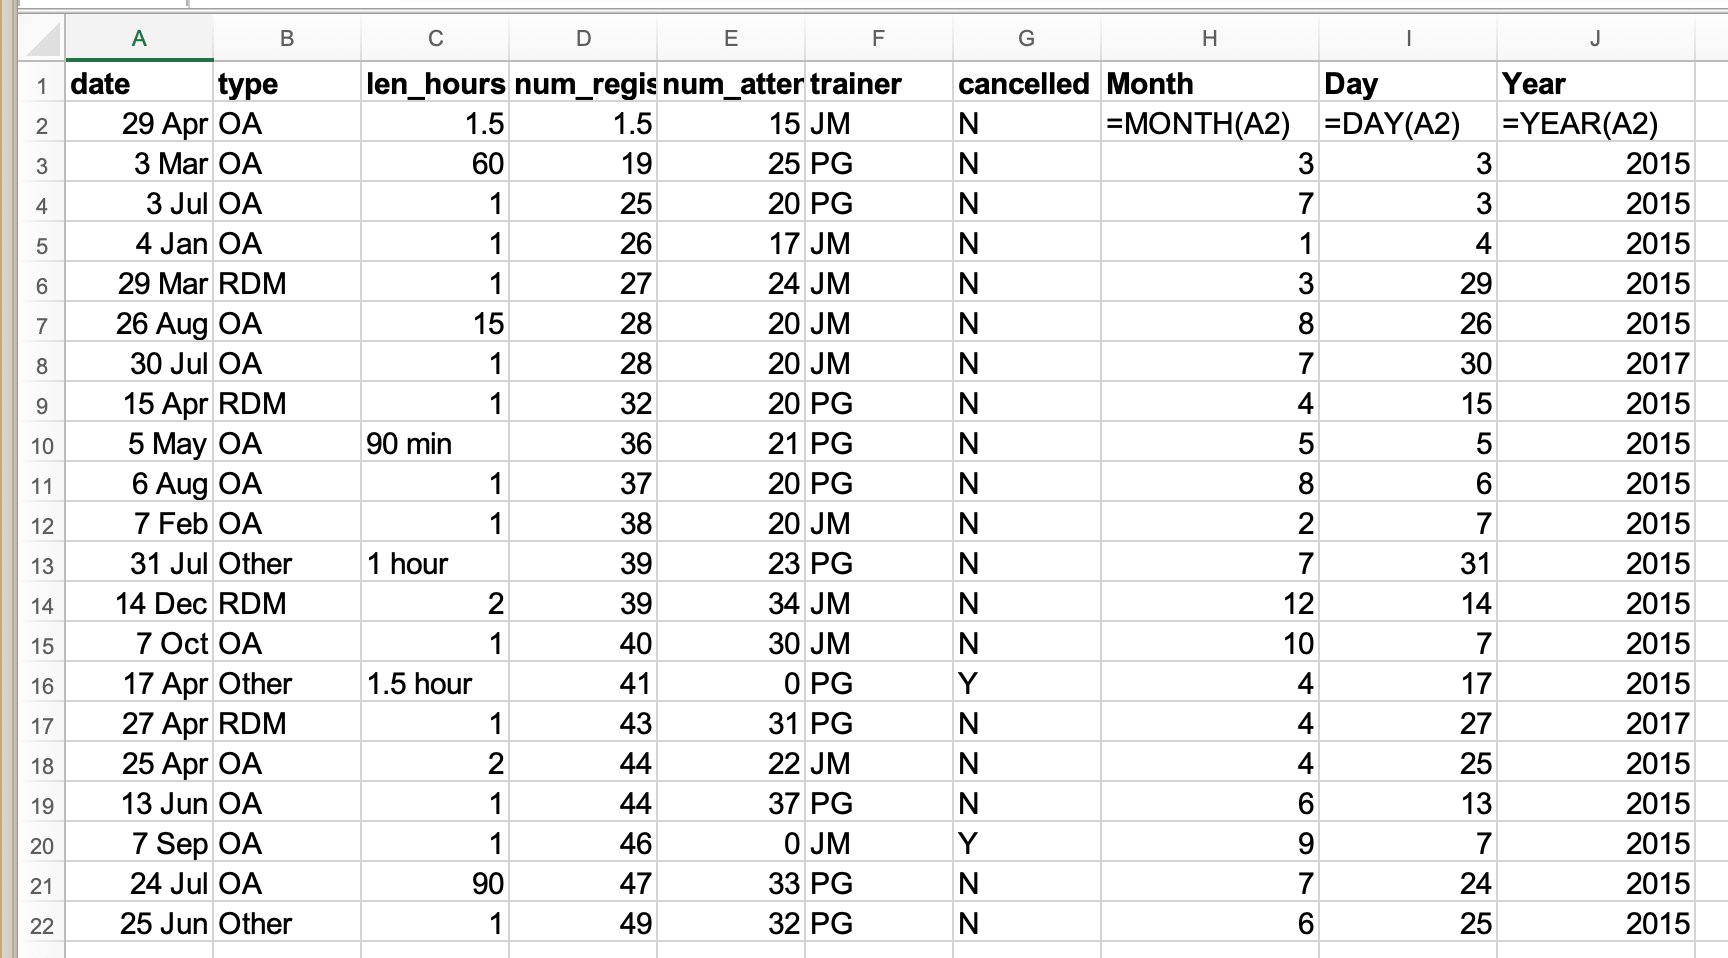
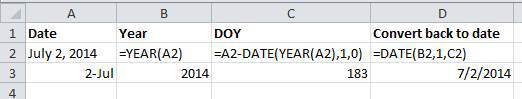
Figure 3
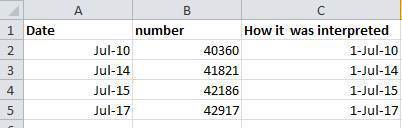
Figure 4
Basic quality assurance and control
Figure 1
Figure 2
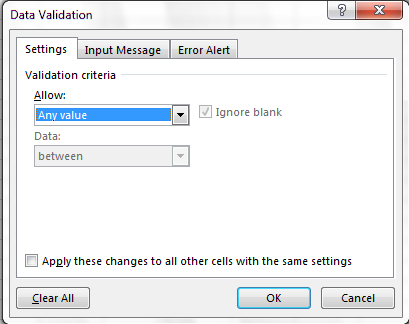
Figure 3
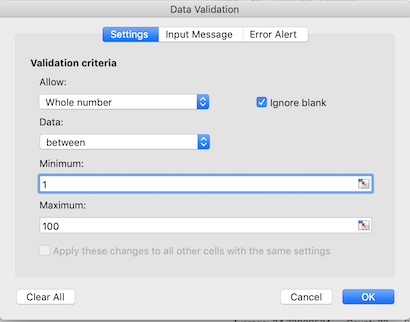
Figure 4
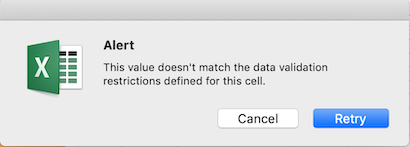
Figure 5
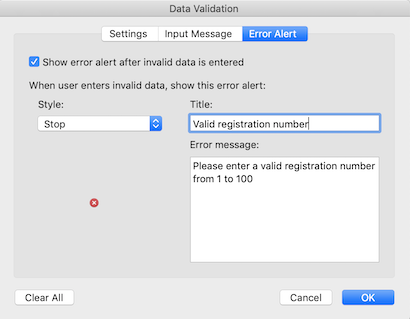
Figure 6
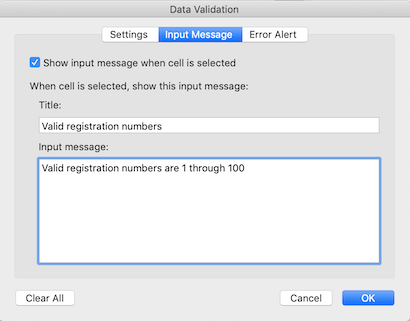
Figure 7
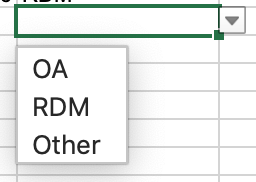
Figure 8
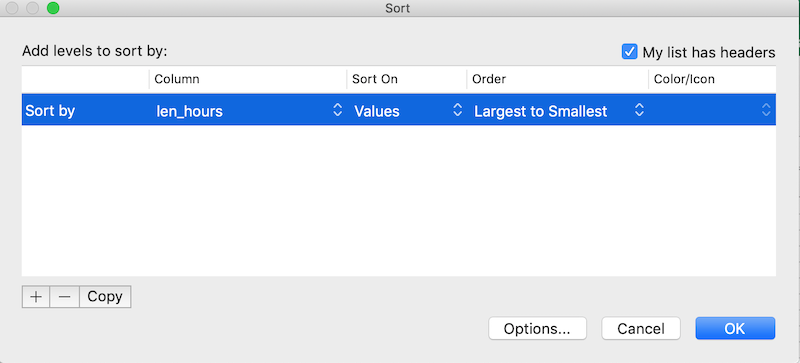
Figure 9
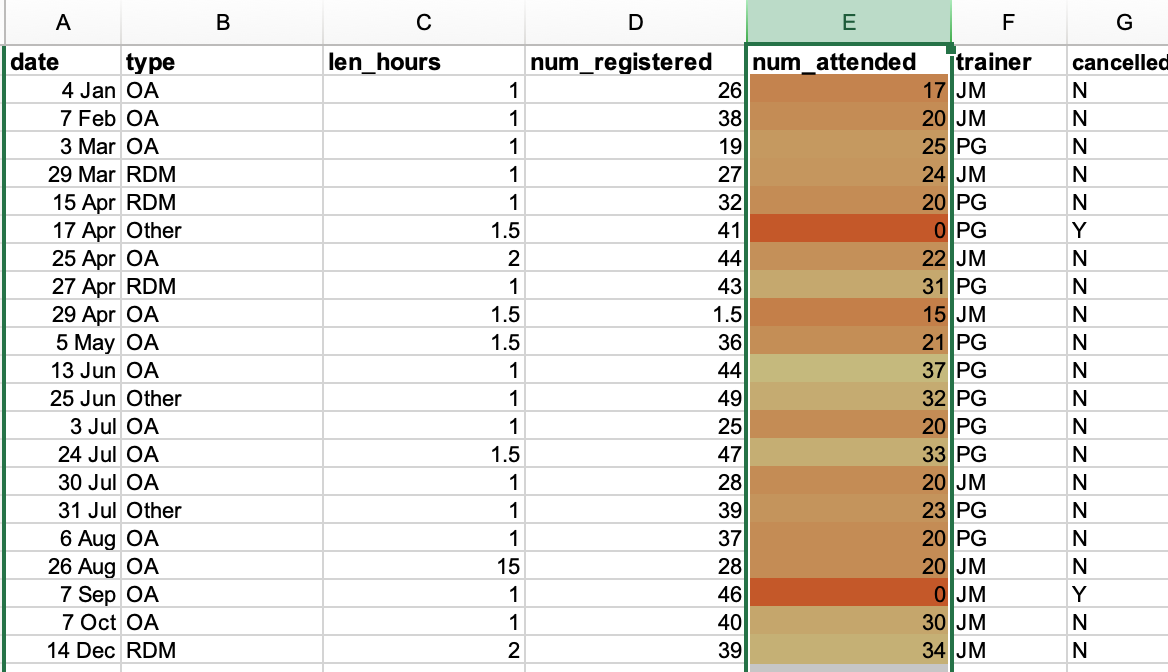
Note how the odd values sort to the top. The cells containing “min”
or “hour” are found towards the top. Larger values like 90, 60 and 15
also are sorted so you can evaluate them. This is a powerful way to
check your data for outliers and odd values. 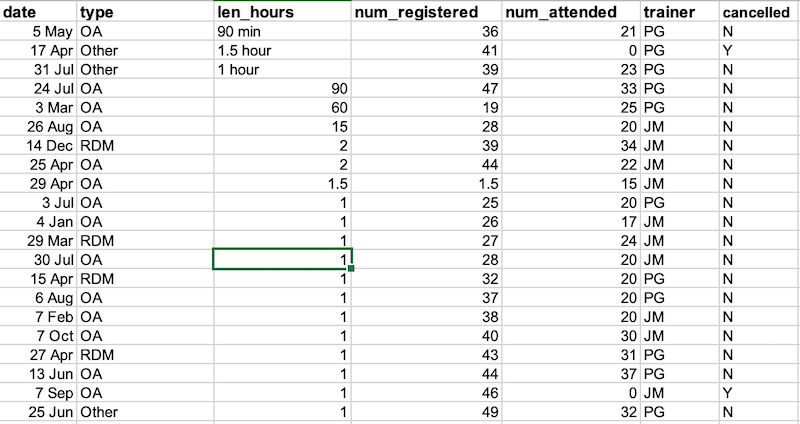
Figure 10
Exporting data from spreadsheets
Figure 1
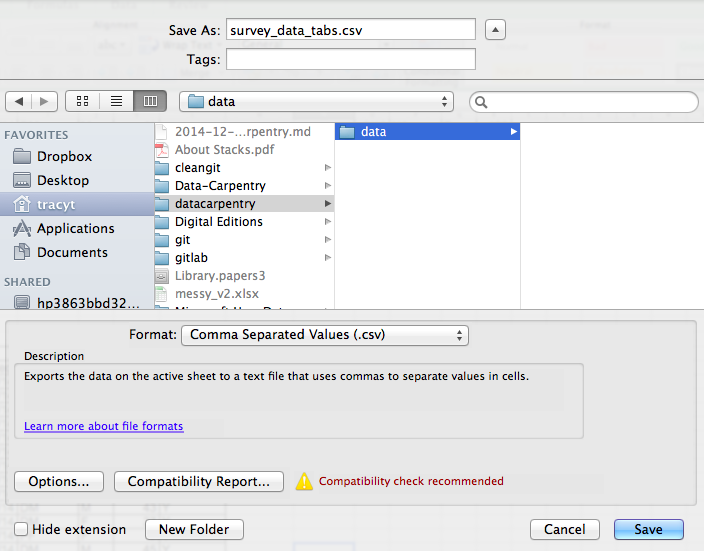
Figure 2
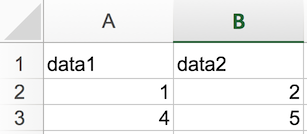
Figure 3
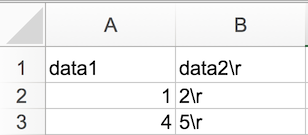
Caveats of popular data and file formats
Figure 1