All in One View
Content from Using spreadsheet programs for data organisation
Last updated on 2025-02-10 | Edit this page
Overview
Questions
- What are good data practices for using spreadsheets for organizing data?
Objectives
- Understanding some drawbacks and advantages of using spreadsheet programs
- Distinguish machine readable tidy data from data that is easy to read for humans
Good data organisation is the foundation of much of our day-to-day work in libraries. Most librarians have data or do data entry in spreadsheets. Spreadsheet programs are very useful graphical interfaces for designing data tables and handling very basic data quality control functions.
Spreadsheets encompass a lot of the things we need to be able to do as librarians. We can use them for:
- Data entry
- Organizing data
- Subsetting and sorting data
- Statistics
- Plotting
Jargon busting (Optional, not included in timing)
The Jargon Busting exercise is a helpful way to begin to explore terms, phrases, and ideas related to code and software development.
Spreadsheet outline
In this lesson, we will look at:
- Good data entry practices - formatting data tables in spreadsheets
- How to avoid common formatting mistakes
- Dates as data - beware!
- Basic quality control and data manipulation in spreadsheets
- Exporting data from spreadsheets
Much of your time when you’re producing a report will be spent in this ‘data wrangling’ stage. It’s not the most fun, but it’s necessary. We’ll teach you how to think about data organisation and some practices for more effective data wrangling.
What this lesson will not teach you
- How to do statistics in a spreadsheet
- How to do plotting in a spreadsheet
- How to write code in spreadsheet programs
If you’re looking to do this, a good reference is Microsoft Excel 365 Bible.
Why aren’t we teaching data analysis in spreadsheets
Data analysis in spreadsheets usually requires a lot of manual work. If you want to change a parameter or run an analysis with a new dataset, you usually have to redo everything by hand. (We do know that you can create macros, but see the next point.)
It is also difficult to track or reproduce statistical or plotting analyses done in spreadsheet programs when you want to go back to your work or someone asks for details of your analysis.
Spreadsheet programs
There are a number of spreadsheet programs available for use on a desktop or web browser:
- LibreOffice Calc
- Microsoft Excel
- Apple Numbers
- Google Sheets
- Gnumeric
- Apache OpenOffice Calc
Commands may differ a bit between programs, but the general idea is the same. In this lesson, we will assume that you are most likely using Excel as your primary spreadsheet program. There are others with similar functionality, including Gnumeric, OpenOffice Calc, and Google Sheets, but Excel is the package you’re most likely to have available on your work computer.
Questions:
- How many people have used spreadsheets in their work?
- What kind of operations do you do in spreadsheets?
- Which ones do you think spreadsheets are good for?
Question
- Spreadsheets can be very useful, but they can also be frustrating and even sometimes give us incorrect results. What are some things that you’ve accidentally done in a spreadsheet, or have been frustrated that you can’t do easily?
Problems with Spreadsheets
Spreadsheets are good for data entry, but in reality we tend to use spreadsheet programs for much more than data entry. We use them to create data tables for publications, to generate summary statistics, and make figures.
Generating tables for reports in a spreadsheet is not optimal - often, when formatting a data table for publication, we’re reporting key summary statistics in a way that is not really meant to be read as data, and often involves special formatting (merging cells, creating borders, making it pretty). We advise you to do this sort of operation within your document editing software.
The latter two applications, generating statistics and figures, should be used with caution: because of the graphical, drag and drop nature of spreadsheet programs, it can be very difficult, if not impossible, to replicate your steps (much less retrace anyone else’s), particularly if your stats or figures require you to do more complex calculations. Furthermore, in doing calculations in a spreadsheet, it’s easy to accidentally apply a slightly different formula to multiple adjacent cells. When using a command-line based statistics program like R or SAS, it’s practically impossible to accidentally apply a calculation to one observation in your dataset but not another unless you’re doing it on purpose.
Using Spreadsheets for Data Entry and Cleaning
HOWEVER, there are circumstances where you might want to use a spreadsheet program to produce “quick and dirty” calculations or figures, and some of these features can be used in data cleaning, prior to importation into a statistical analysis program. We will show you how to use some features of spreadsheet programs to check your data quality along the way and produce preliminary summary statistics.
In this lesson, we’re going to talk about:
- Formatting data tables in spreadsheets
- Formatting problems
- Dates as data
- Basic quality control and data manipulation in spreadsheets
- Exporting data from spreadsheets
- Data export formats caveats
- We will discuss good practices for data entry and formatting
- We will not discuss analysis or visualisation
Content from Formatting data tables in Spreadsheets
Last updated on 2026-02-13 | Edit this page
Overview
Questions
- How should data be formatted in spreadsheets?
Objectives
- Describe best practices for data entry and formatting in spreadsheets.
- Apply best practices to arrange variables and observations in a spreadsheet.
The most common mistake made is treating the program like it is a notebook by relying on context, notes in the margin, spatial layout of data and fields to convey information. As humans, we can (usually) interpret these things, but computers are unintelligent, and unless we explain to the computer what every single thing means (and that can be hard!) it will not be able to see how our data fit together.
Using the power of computers, we can manage and analyze data in much more effective and faster ways, but to use that power, we have to set up our data for the computer to be able to understand it (and computers are very literal).
This is why it’s extremely important to set up well-formatted tables from the outset before you even start collecting data to analyse. Data organisation is the foundation of your data-related work. Unorganised data can make it harder to work with your data, so you should be mindful of your data organisation when doing your data entry. You’ll want to organise your data in a way that allows other programs and people to easily understand and use the data.
Callout
Note: the best layouts/formats (as well as software and interfaces) for data entry and data analysis might be different. It is important to take this into account, and ideally automate the conversion from one to another.
Keeping track of your analyses
When working with spreadsheets during data clean up or analyses, it’s very easy to end up with a spreadsheet that looks very different from the one you started with. In order to be able to reproduce your analyses or figure out what you did when your leadership team ask for a different analysis, you should:
- create a new file with your cleaned or analyzed data. Don’t modify the original dataset, or you will never know where you started!
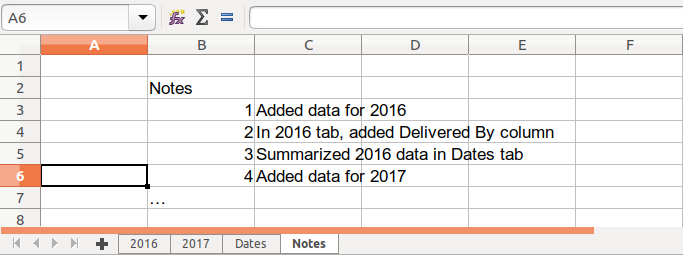
- keep track of the steps you took in your clean up or analysis. You should track these steps as you would any step in an experiment. We recommend that you do this in a plain text file stored in the same folder as the data file.
- record the steps you followed in your data cleanup or analysis. Just as you would document key actions in a research project, it’s important to keep a clear record of your workflow. We suggest saving this documentation in a plain text file within the same folder as your data file for easy access and organisation.
This might be an example of the setup as you work:
We will put these principles into practice today during your exercises.
Structuring data in spreadsheets
The cardinal rules of using spreadsheet programs for data:
- Put all your variables in columns - the thing you’re measuring, like ‘length’ or ‘attendance’.
- Put each observation in its own row.
- Don’t combine multiple pieces of information in one cell. Sometimes it just seems like one thing, but think if that’s the only way you’ll want to be able to use or sort that data.
- Leave the raw data raw - don’t mess with it!
- Export the cleaned data to a text based format like CSV. This ensures that anyone can use the data, and is the format required by most data repositories.
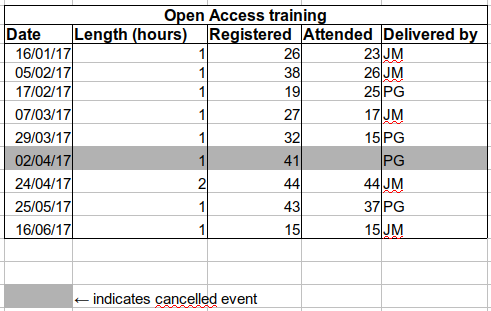
For instance, we have data from attendance and instruction for previous research data management workshops. Different people have entered data into a single spreadsheet. They keep track of things like date, number of attendees, and who delivered the workshop.
If they were to keep track of the data like this:
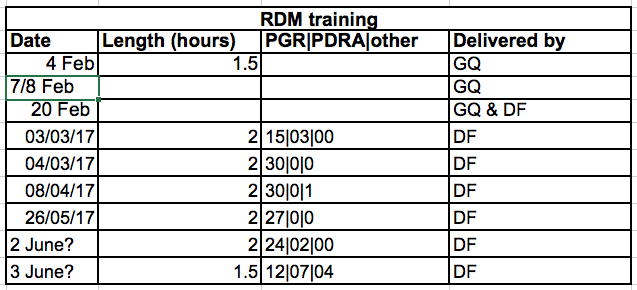
the problem is that the number of attendees of different types (post-graduate researcher (PGR), post-doctoral research associate (PDRA), and other) are in the same field. So if they wanted to look at attendance by post-graduate researchers, it would be hard to set up the data to do this. If instead we put attendee categories in different columns, you can see that it would be much easier.
Columns for variables and rows for observations
The rule of thumb, when setting up a datasheet, is columns = variables, rows = observations, cells = data (values).
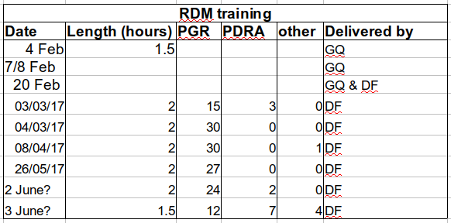
So, instead we should have:
Exercise
We’re going to take a messy version of some library training data and clean it up.
- First download the data
- Open up the data in a spreadsheet program.
- You can see that there are three tabs. Various people have recorded training attendance statistics over 2016 and 2017, and they have kept track of the data in their own way. Now you’re being asked to evaluate the training programme and you want to be able to start doing statistics with the data.
- With the person next to you, work on the messy data so that a computer will be able to understand it. Clean up the 2016 and 2017 tabs, and put them all together in one spreadsheet.
- After you go through this exercise, we’ll discuss as a group what you think was wrong with this data and how you fixed it.
Important
Do not forget our first piece of advice: create a new file for the cleaned data, and never modify the original (raw) data.
An excellent reference, in particular with regard to R scripting is
Resource
Hadley Wickham, Tidy Data, Vol. 59, Issue 10, Sep 2014, Journal of Statistical Software. http://www.jstatsoft.org/v59/i10.
- Use one column for one variable
- Use one row for one observation
- Use one cell for one value
- Never modify your raw data. Always make a copy before making any changes.
- Keep all of the steps you take to clean your data in a plain text file.
Content from Formatting problems
Last updated on 2025-02-25 | Edit this page
Overview
Questions
- What common mistakes are made when formatting spreadsheets?
Objectives
- Recognize and resolve common spreadsheet formatting problems.
Common Spreadsheet Errors
- Multiple tables
- Multiple tabs
- Not filling in zeros
- Using bad null values
- Using formatting to convey information
- Using formatting to make the data sheet look pretty
- Placing comments or units in cells
- More than one piece of information in a cell
- Field name problems
- Special characters in data
- Inclusion of metadata in data table
- Date formatting
Multiple tables
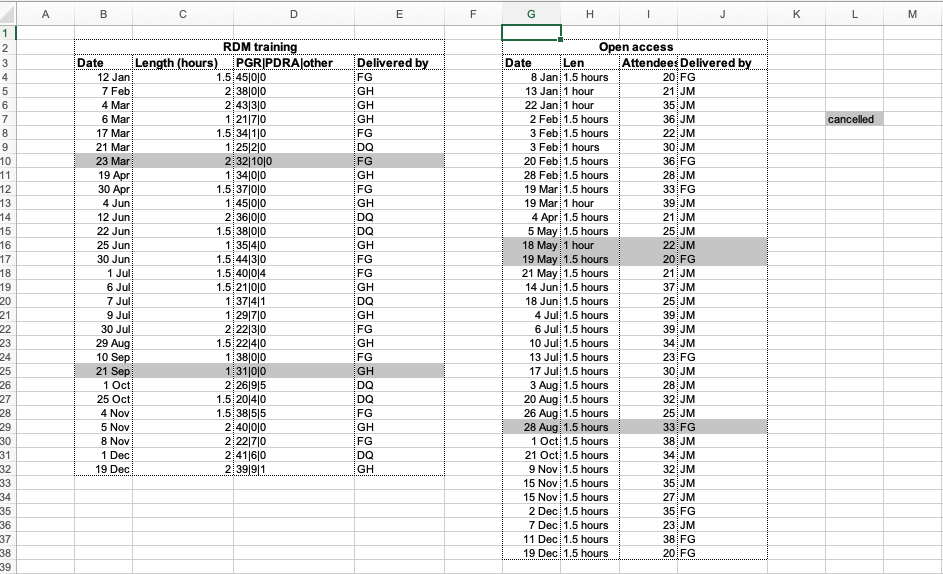
A common strategy is creating multiple data tables within one spreadsheet. This confuses the computer, so don’t do this! When you create multiple tables within one spreadsheet, you’re drawing false associations between things for the computer, which sees each row as an observation. You’re also potentially using the same field name in multiple places, which will make it harder to clean your data up into a usable form. The example below depicts the problem:
Multiple tabs
But what about worksheet tabs? That seems like an easy way to organise data, right? Well, yes and no. When you create extra tabs, you fail to allow the computer to see connections in the data that are there (you have to introduce spreadsheet application-specific functions or scripting to ensure this connection). Say, for instance, you make a separate tab for each year.
This is bad practice for two reasons: 1) you are more likely to accidentally add inconsistencies to your data if each time you take a measurement, you start recording data in a new tab, and 2) even if you manage to prevent all inconsistencies from creeping in, you will add an extra step for yourself before you analyze the data because you will have to combine these data into a single datatable. You will have to explicitly tell the computer how to combine tabs - and if the tabs are inconsistently formatted, you might even have to do it by hand!
The next time you’re entering data, and you go to create another tab or table, I want you to ask yourself “Self, could I avoid adding this tab by adding another column to my original spreadsheet?”
Your data sheet might get very long over the course of recording data. This makes it harder to enter data if you can’t see your headers at the top of the spreadsheet. But do NOT repeat headers. These can easily get mixed into the data, leading to problems down the road.
Instead you can Freeze the column headers.
Documentation on how to freeze column headers in Microsoft Excel
Documentation on how to freeze column headers in LibreOffice Calc
Documentation on how to freeze column headers in Google Sheets
Not filling in zeroes
It might be that when you’re measuring something, it’s usually a zero, say the number of participants at a training event. Why bother writing in the number zero in that column, when it’s mostly zeros?
However, there’s a difference between a zero and a blank cell in a spreadsheet. To the computer, a zero is actually data. You measured or counted it. A blank cell means that it wasn’t measured and the computer will interpret it as a null value.
The spreadsheets or statistical programs will likely mis-interpret blank cells that are meant to be zero. This is equivalent to leaving out data. Zero observations are real data! Leaving zero data blank is not good in a written format, but NEVER okay when you move your data into a digital format.
Using bad null values
Example: using -999, other numerical values, zero, or text to represent missing values. Whatever the reason, it’s a problem if unknown or missing data is recorded as -999, 999, or 0. Many statistical programs will not recognize that these are intended to represent missing (null) values. How these values are interpreted will depend on the software you use to analyze your data.
Solution: A solution will depend on the final
application of your data and how you intend to analyse it, but it is
essential to use a clearly defined and CONSISTENT null indicator. Blank
cells are the best choices for most applications; when working in R,
NA may be an acceptable null value choice.
There are many reasons that null values may be represented
differently within a dataset. Sometimes confusing null values are
automatically recorded from the measuring device. In that case, there’s
not much you can do, but such inconsistencies can often be addressed in
data cleaning with a tool like OpenRefine
before using or sharing the data. In other cases, null values may convey
different reasons why the data is missing. It may be useful to capture
these reasons, but if you use the same column it is effectively storing
two pieces of information in one column. In such a case, it would be
good to create a new column like data_missing, then to use
that column to capture the reasons for missing data.
| Null Values | Problems | Compatibility | Recommendation |
|---|---|---|---|
| 0 | Indistinguishable from a true zero | NEVER use | |
| Blank | Hard to distinguish values that are missing from those overlooked on entry. Hard to distinguish blanks from spaces, which behave differently. | R, Python, SQL, Excel | Best option |
| -999, 999 | Not recognized as null by many programs without user input. Can be inadvertently entered into calculations. | Avoid | |
| NA, na | Can also be an abbreviation (e.g., North America), can cause problems with data type (turn a numerical column into a text column). NA is more commonly recognized than na. | R | Good option |
| N/A | An alternate form of NA, but often not compatible with software. | Avoid | |
| NULL | Can cause problems with data type. | SQL | Good option |
| None | Uncommon. Can cause problems with data type. | Python | Avoid |
| No data | Uncommon. Can cause problems with data type, contains a space. | Avoid | |
| Missing | Uncommon. Can cause problems with data type. | Avoid | |
| -, +, . | Uncommon. Can cause problems with data type. | Avoid |
Choices for representing null values, as illustrated in the table above, are proposed and explained further by White and others in their article: Nine simple ways to make it easier to (re)use your data. Ideas in Ecology and Evolution 6 (2013): 1-10. DOI: 10.4033/iee.2013.6b.6.f
Using formatting to convey information
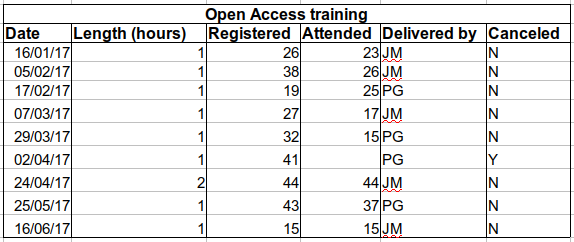
Example: highlighting cells, rows or columns that should be excluded from an analysis, leaving blank rows to indicate separations in data.
Solution: create a new field to encode which data should be excluded.
Using formatting to make the data sheet look pretty
Example: merging cells.
Solution: If you’re not careful, formatting a worksheet to be more aesthetically pleasing can compromise your computer’s ability to see associations in the data. Merged cells are an absolute formatting NO-NO if you want to make your data readable by statistics software. Consider restructuring your data in such a way that you will not need to merge cells to organise your data.
Placing comments or units in cells
Example: Your data was collected, in part, by a summer student who you later found out was mis-recording the duration of training sessions, some of the time. You want a way to note these data are suspect.
Solution: Most statistical programs can’t see Excel’s comments, and would be confused by comments placed within your data cells. As described above for formatting, create another field if you need to add notes to cells. Similarly, don’t include units in cells (such as “hours”,“min”): ideally, all the units or measurements you place in one column should be of the same standard, but if for some reason they aren’t, insert another column and specify the units.
More than one piece of information in a cell
Example: One table recorded attendance by the different types of attendees. This table recorded number of attendees of different types: post-graduate researcher (PGR), post-doctoral research associate (PDRA), and other.
Solution: Never include more than one piece of information in a cell. Design your data sheet to include a column for each type of attendee, if this information is important to collect, rather than just a total number.
Field name problems
Choose descriptive field names, but be careful not to include:
spaces, numbers, or special characters of any kind. Spaces can be
misinterpreted by parsers that use whitespace as delimiters and some
programs don’t like field names that are text strings that start with
numbers. Underscores (_) are a good alternative to spaces
and consider writing names in camel-case to improve readability.
Remember that abbreviations that make sense at the moment may not be so
obvious in 6 months but don’t overdo it with names that are excessively
long. Including the units in the field names avoids confusion and
enables others to readily interpret your fields.
Examples
| Good Name | Good Alternative | Avoid |
|---|---|---|
| Max_temp_C | MaxTemp | Maximum Temp (°C) |
| Precipitation_mm | Precipitation | precmm |
| Mean_year_growth | MeanYearGrowth | Mean growth/year |
| sex | sex | M/F |
| length | length | l |
| cell_type | CellType | Cell Type |
| Observation_01 | first_observation | 1st Obs |
Special characters in data
Example: You treat Excel as a word processor when writing notes, even copying data directly from Word or other applications.
Solution: This is a common strategy. For example, when writing longer text in a cell, people often include line breaks, em-dashes, et al in their spreadsheet. Worse yet, when copying data in from applications such as Word, formatting and fancy non-standard characters (such as left- and right-aligned quotation marks) are included. When exporting this data into a coding/statistical environment or into a relational database, dangerous things may occur, such as lines being cut in half and encoding errors being thrown.
General best practice is to avoid adding characters such as newlines, tabs, and vertical tabs. In other words, treat a text cell as if it were a simple web form that can only contain text and spaces.
Inclusion of metadata in data table
Example: You add a legend at the top or bottom of your data table explaining column meaning, units, exceptions, etc.
Solution: While recording data about your data (“metadata”) is essential, this information should not be contained in the data file itself. Unlike a table in a paper or a supplemental file, metadata (in the form of legends) should not be included in a data file since this information is not data, and including it can disrupt how computer programs interpret your data file. Rather, metadata should be stored as a separate file in the same directory as your data file, preferably in plain text format with a name that clearly associates it with your data file. Because metadata files are free text format, they also allow you to encode comments, units, information about how null values are encoded, etc. that are important to document but can disrupt the formatting of your data file.
- Don’t use multiple tables in one sheet
- Don’t use multiple tabs in a file
- Fill in zero when you mean zero
- Use an appropriate null value to record missing data
- Don’t use formatting to convey information or make the spreadsheet look pretty
- Don’t put units or comments in cells
- Don’t combine several values in one cell
- Take care over column names
- Avoid including special characters in your data file
- Put metadata (units, legends etc.) in a separate file
Content from Dates as data
Last updated on 2026-02-13 | Edit this page
Overview
Questions
- How are dates handled by computers?
Objectives
- Describe how dates are stored and formatted in spreadsheets.
- Describe the advantages of alternative date formatting in spreadsheets.
- Demonstrate best practices for entering dates in spreadsheets.
Dates in spreadsheets are often stored in one column. Whilst this
seems the most natural way to enter dates, it actually is not a good
practice. A spreadsheet application may display the dates correctly (for
readability) but how it actually handles and stores the dates may be
problematic. This can cause problems if the date displayed does not
fully represent the information that the spreadsheet application is
using, such as when the year is not displayed; in addition, date
information may be changed when data is converted to different
spreadsheet formats, such as between .xlsx and
.csv, or opened in different applications.
Date formats in spreadsheets
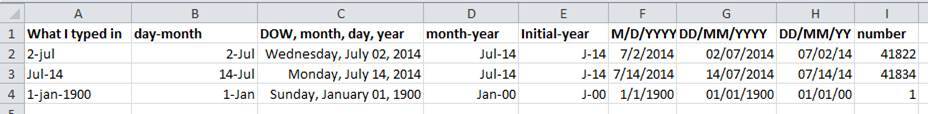
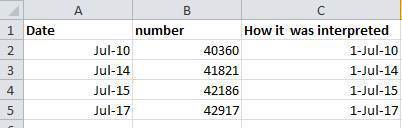
Spreadsheet applications employ numerous features that facilitate the processing and display of date information. While these features often make date information more easily readable, the underlying data handling techniques can create data ambiguity in a variety of ways. The figure below illustrates some of the ways that the display of information representing the same date can vary. Column A is the information as entered by a user, and the following columns show different ways that the information may be displayed.
How can these features create data ambiguity?
Ideally, data should be as unambiguous as possible.
- What do you notice about the display of the date information above? What information changes between the columns?
- What aspects of the display lack specificity and may introduce ambiguity?
Displaying dates
The figure above shows that ambiguity may creep into your data in numerous ways depending on the format you chose when you entered your data. If you’re not fully aware of these ambiguities, you may find that Excel will interpret your data in unexpected ways later.
The display format of each cell can be modified. To change the display in Excel, navigate to the Format menu and choose “Cells…”. In the “Format Cells” dialog box, you can select a Date format and choose various display outputs (some are shown in the above figure). In the dialog box, you can also choose to format the cell as a number or text. It may be useful to format the cell as one of these other datatypes, since as we will discuss next, the spreadsheet program understands the date information as a number.
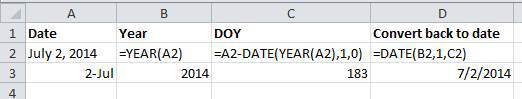
Storing dates
Spreadsheet applications, including Excel, store dates as a
number (see Column I in the figure above). The application
developers chose a single day to designate as day zero, and each
subsequent day is incremented by a value of one. Essentially, Excel
counts the days from a default of December 31, 1899. Thus, July 2, 2014
is stored as the serial number 41822 because it is 41,822
days after day zero. Not all applications or operating systems use the
same date for day zero.
Understanding the spreadsheet program uses serial numbers to process dates can be useful in some circumstances. Using the above functions, you can easily add days, months or years to a given date. Say you had a sampling plan where you needed to sample every thirty seven days. In another cell, you could input the following:
=B2+37This would display:
OUTPUT
8-AugThis happens because Excel processes the date July 2, 2014 as the
number 41822. Adding 41822 + 37 results in
41859 which Excel interprets as August 8, 2014. The program
retains the format (for the most part) of the cell that is being
operated upon (unless you did some sort of formatting to the cell
before, and then all bets are off). Month and year rollovers are
internally tracked and applied.
Working with historical dates (before 1900)
Excel is unable to parse dates from before 1899-12-31, and will thus leave these untouched. If you’re mixing historic data from before and after this date, Excel will translate only the post-1900 dates into its internal format, thus resulting in mixed data. If you’re working with historic data, be extremely careful with your dates!
Excel also entertains a second date system, the 1904 date system, as the default in Excel for Macintosh. This system will assign a different serial number than the 1900 date system. Because of this, dates must be checked for accuracy when exporting data from Excel (look for dates that are about 4 years off).
Useful spreadsheet functions for working with date information
Let’s take a look at some functions that will help us work with date information in spreadsheet applications. Please remember that functions that are valid for a given spreadsheet program (be it LibreOffice, Microsoft Excel, OpenOffice.org, Gnumeric, etc.) are usually guaranteed to be compatible only within the same family of products. So, if you will later need to export the data and need to conserve the timestamps you should consider recording date information using one of the solutions discussed below.
If a date is entered in one column, we can use functions to extract information from that column into other columns. For example, it can be useful to display the specific information about the year, month, and day. Conversely, these functions can convert supplied numerical values from numbers into dates. Date-related functions allow us to convert date values from the stored numerical value to a readable display value, make calculations between date values, and also to extract the date values so that they do not change as data is transformed or exchanged between new users and systems.
The table below outlines a few useful date-related functions and how they differ between some of the widely used spreadsheet applications.
| Action of function | Excel | LibreOffice | OpenOffice |
|---|---|---|---|
| Return the year number represented in the referenced cell value | YEAR() |
YEAR() |
|
| Return the month number represented in the referenced date serial number | MONTH() |
MONTH() |
|
| Return the day of the month represented in the referenced date serial number | DAY() |
DAY() |
|
| Calculate and display a date based on supplied year, month, and day values | DATE(Year, Month, Day) |
DATE(Year; Month; Day) |
|
| Return the serial number for date information supplied as a string | DATEVALUE() |
DATEVALUE("Text") |
|
| Change display of a number by applying specified formatting | TEXT(Value, "Formatting code to apply") |
TEXT(Value; "Formatting to apply") |
|
| Return the current system date | NOW() |
NOW() |
You can see that even though you wanted the year to be 2015 for all
entries, your spreadsheet program interpreted two entries as 2017, the
year the data was entered, not the year of the workshop. 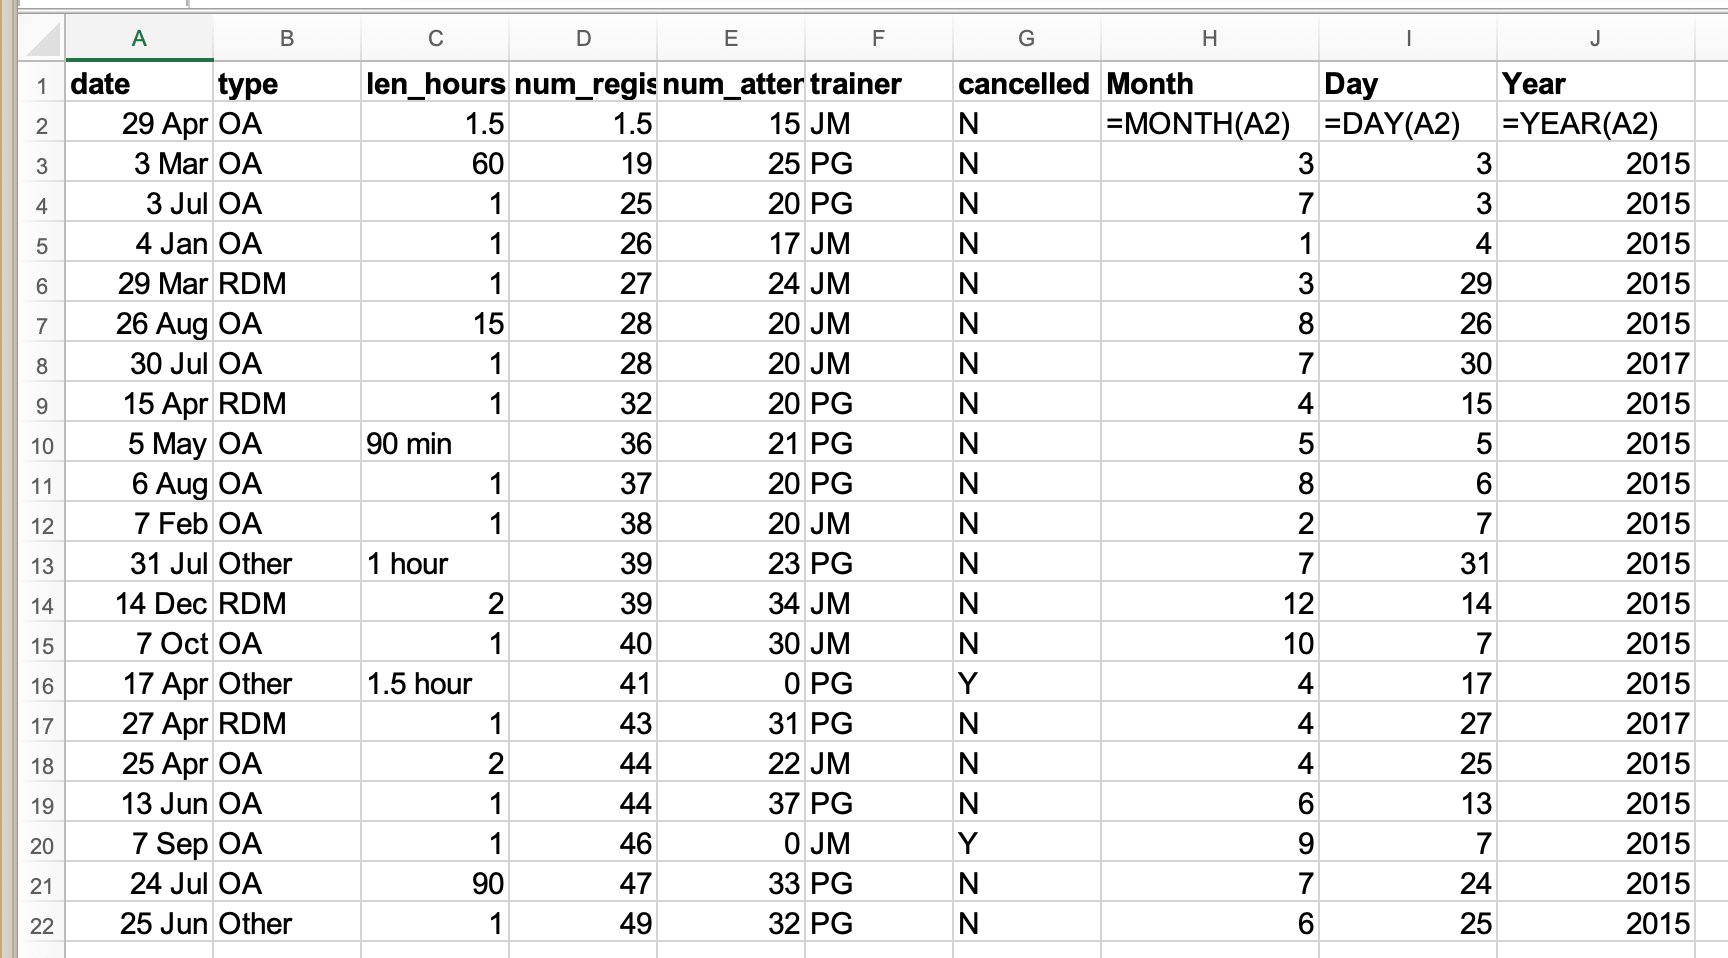
Adding dates
Adding years and months and days is slightly trickier because we need to make sure that we are adding the amount to the correct entity.
- First we extract the single entities (day, month, or year)
- We can then add values to do that
- Finally the complete date string is reconstructed using the
DATE()function.
Note: Time values raise similar challenges. Seconds can be directly added but to add hours and minutes you will need to make sure that quantities are added to the correct entities.
Advantages of Alternative Date Formatting
The display ambiguities discussed above can lead to unintended changes or unknown errors in your data. Exchanging data between applications or converting data into different formats can also create unexpected changes. Similar issues also cause challenges for data interoperability, sharing and reuse, and long-term preservation. Alternative date formats can help to address these issues, and we will learn about three below. First, however, let’s explore the challenges further by seeing what happens to date information when converted between different formats.
Exchanging Date Information between Formats
What happens to the dates in the dates tab of our
workbook if we save this sheet in Excel (in csv format) and
then open the file in a plain text editor (like TextEdit or Notepad)?
What happens to the dates if we then open the csv file in
Excel?
- Click to the
datestab of the workbook and double-click on any of the values in theDate collectedcolumn. Notice that most of the dates display with the year 2015 and two are 2017. - Select
File -> Save Asin Excel and in the drop down menu for file format selectCSV UTF-8 (Comma delimited) (.csv). ClickSave. - You will see a pop-up that says ‘This workbook cannot be saved in
the selected file format because it contains multiple sheets.’ Choose
Save Active Sheet. - Navigate to the file in Finder (Mac) or Explorer (Windows). Right
click and select
Open With. Choose a plain text editor application and view the file. Notice that the dates display as month/day without any year information. - Now right click on the file again and open with Excel. Notice that the dates display with the current year, not 2015. As you can see, exporting data from Excel and then importing it back into Excel fundamentally changed the data once again!
Storing dates as YEAR, MONTH, DAY
Storing dates in YEAR, MONTH, DAY format helps remove this ambiguity. Let’s look at this issue a bit closer.
For instance, in a spreadsheet recording insect counts every few days
in July 2001, the data displayed as shown below in Column A. Note that
the data was recorded in only one cell in each row, and the data only
included reference to the month and day
(<MONTH>-<DAY>).
When interpreted in Excel, it appears that the observations had been recorded in 2010, 2014, 2015 and 2017 even though our records state that the data was gathered in 2001.
Entering dates in one cell is helpful but due to the fact that the spreadsheet programmes may interpret and save the data in different ways (doing that somewhat behind the scenes), there is a better practice.
In dealing with dates in spreadsheets, we recommend separating date data into separate fields (day, month, year), which will eliminate any chance of ambiguity.
Storing dates as YEAR, DAY-OF-YEAR
There is also another option: You can also store dates as year, and day of year (DOY). Why? Because depending on your question, this might be what’s useful to you, and there is practically no possibility for ambiguity creeping in.
Statistical models often incorporate year as a factor, to account for year-to-year variation, and DOY can be used to measure the passage of time within a year.
So, can you convert all your dates into DOY format? Well, in Excel, here’s a handy dandy guide:
Storing dates and times as a single string
When dealing with dates and times, the best alternative is to convert
the date string into a single string using the
YYYYMMDDhhmmss format, following the international date
standard ISO 8601.
For example the date March 24, 2015 17:25:35 would become
20150324172535, where:
YYYY:   the full year, i.e. 2015
MM:     the month, i.e. 03
DD:     the day of month, i.e. 24
hh:     hour of day, i.e. 17
mm:     minutes, i.e. 25
ss:     seconds, i.e. 35
Such strings will be correctly sorted in ascending or descending order, and by knowing the format they can then be correctly processed by the receiving software.
Preferred date format
Due to the issues caused by the way that spreadsheet programs handle and display dates, it is safer to store dates with YEAR, MONTH, DAY in separate columns or as YEAR and DAY-OF-YEAR in separate columns. This practice will make your data less ambiguous, will guard against changes that may be caused if the spreadsheet is opened by other software, and generally make your data table more accessible and interoperable.
Further Resources
Working with dates and day of year information can be unfamiliar since it does not match how we typically see dates on a calendar by the day of a month. These resources provide useful information for calculating the day of the year:
- The Earth Systems Research Lab provides this calendar that displays day of year information for any year you select: https://www.esrl.noaa.gov/gmd/grad/neubrew/Calendar.jsp.
- The U.S. National Snow and Ice Data Center provides a useful chart to calculate the day of year: https://nsidc.org/support/faq/day-year-doy-calendar.
Most spreadsheet applications offer more detailed information about working with date and time information. Some of these are referenced below:
- Microsoft Excel date and time functions reference.
- LibreOffice Date & Time Functions Reference v. 6.2.
- Excel is notoriously bad at handling dates.
- Treating dates as multiple pieces of data rather than one makes them easier to handle and exchange between programs.
Content from Basic quality assurance and control
Last updated on 2026-02-13 | Edit this page
Overview
Questions
- How can you keep data entry clean?
Objectives
- Apply quality assurance techniques to limit incorrect data entry.
- Apply quality control techniques to identify errors in spreadsheets.
When you have a well-structured data table, you can use several simple techniques within your spreadsheet to ensure the data you enter is free of errors. These approaches include techniques that are implemented prior to entering data (quality assurance) and techniques that are used after entering data to check for errors (quality control).
Quality Assurance
Quality assurance stops bad data from ever being entered by checking to see if values are valid during data entry. For example, if research is being conducted at sites A, B, and C, then the value V (which is right next to B on the keyboard) should never be entered. Likewise if one of the kinds of data being collected is a count, only integers greater than or equal to zero should be allowed.
To control the kind of data entered into a spreadsheet we use Data Validation (Excel) or Validity (LibreOffice Calc), to set the values that can be entered in each data column.
Select the cells or column you want to validate
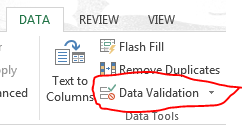
On the
Datatab selectData Validation
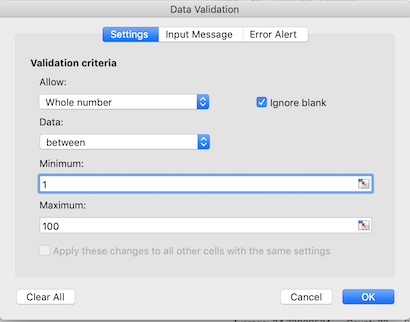
- In the
Allowbox select the kind of data that should be in the column. Options include whole numbers, decimals, lists of items, dates, and other values.
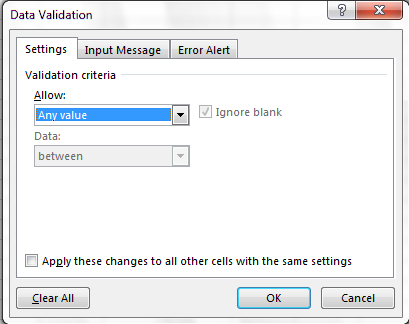
- After selecting an item enter any additional details. For example if
you’ve chosen a list of values then enter a comma-delimited list of
allowable values in the
Sourcebox.
We can’t have half a person attending a workshop, so let’s try this
out by setting the num_registered column in our spreadsheet
to only allow whole numbers between 1 and 100.
- Select the
num_registeredcolumn - On the
Datatab selectData Validation - In the
Allowbox selectWhole number - Set the minimum and maximum values to 1 and 100.
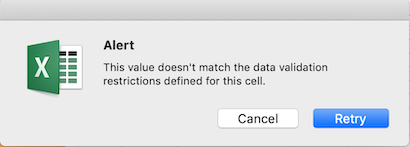
Now let’s try entering a new value in the num_registered
column that isn’t a valid class size. The spreadsheet stops us from
entering the wrong value and asks us if we would like to try again.
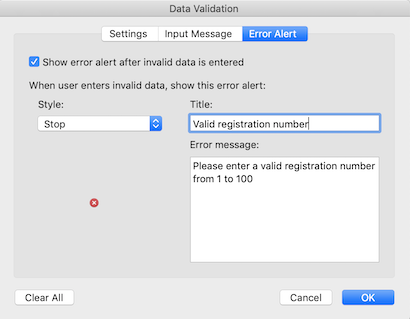
You can customize the resulting message to be more informative by
entering your own message in the Error Alert tab, and you
can edit the Style for when a non-valid value is entered,
by not allowing other values or just give a warning about non valid
entries.
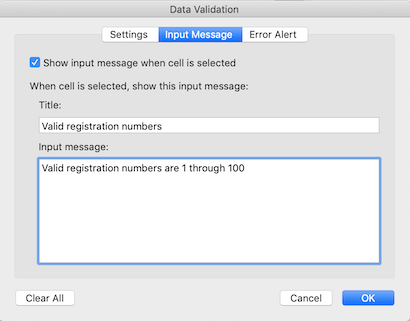
to display a (pop up) message about the correct values for a column
with Data Validation set, use the Input Message tab.
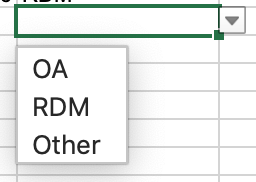
Quality assurance can make data entry easier as well as more robust. For example, if you use a list of options to restrict data entry, the spreadsheet will provide you with a drop-downlist of the available items. So, instead of trying to remember the workshop title abbreviation, you can just select the right option from the list.
Quality Control
Tip!
Before doing any quality control operations, save your original file with the formulas and a name indicating it is the original data. Create a separate file with appropriate naming and versioning, and ensure your data is stored as values and not as formulas. Because formulas refer to other cells, and you may be moving cells around, you may compromise the integrity of your data if you do not take this step!
readme (README) files: As you start manipulating your data files, create a readme document / text file to keep track of your files and document your manipulations so that they may be easily understood and replicated, either by your future self or by an independent researcher. Your readme file should document all of the files in your data set (including documentation), describe their content and format, and lay out the organizing principles of folders and subfolders. For each of the separate files listed, it is a good idea to document the manipulations or analyses that were carried out on those data. Cornell University’s Research Data Management Service Group provides detailed guidelines for how to write a good readMe file, along with an adaptable template.
Sorting
Bad values often sort to bottom or top of the column. For example, if your data should be numeric, then alphabetical and null data will group at the ends of the sorted data. Sort your data by each field, one at a time. Scan through each column, but pay the most attention to the top and the bottom of a column. If your dataset is well-structured and does not contain formulas, sorting should never affect the integrity of your dataset.
Exercise
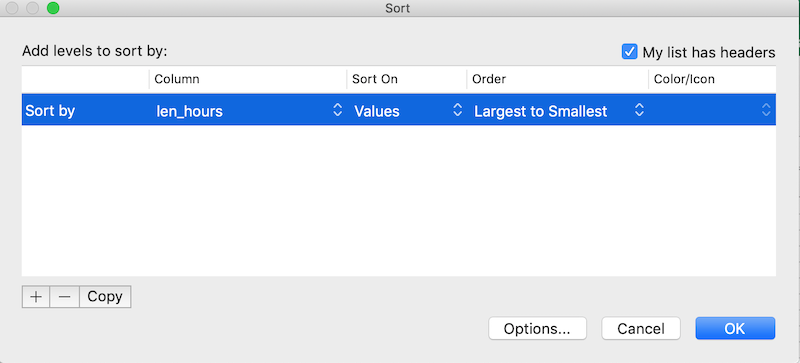
Let’s try this with the Dates tab in our messy spreadsheet. Go to that tab. Select Data then select Sort
Sort by len_hours in the order Largest to
Smallest
When you do this sort, do you notice anything strange?
Try sorting by other columns. Anything strange there?
Click the Sort button on the Data tab in Excel. A pop-up will appear.
The following window will display, choose the column you want to sort as well as the sort order.
Note how the odd values sort to the top. The cells containing “min”
or “hour” are found towards the top. Larger values like 90, 60 and 15
also are sorted so you can evaluate them. This is a powerful way to
check your data for outliers and odd values. 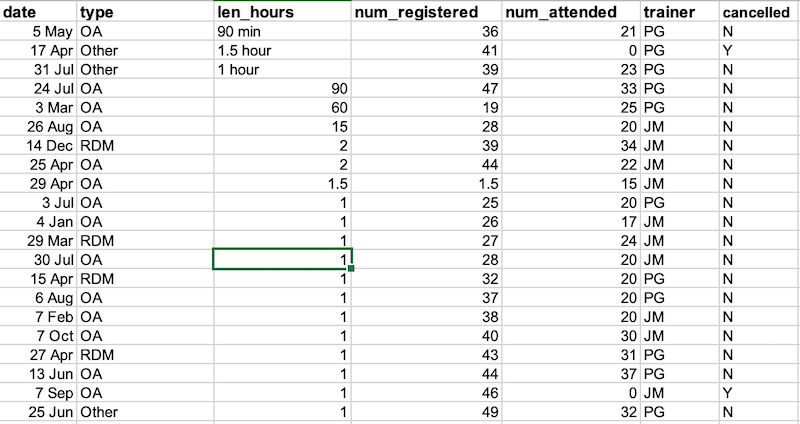
Conditional formatting
Use with caution! But a great way to flag inconsistent values when entering data.
Conditional formatting basically can do something like color code your values by some criteria or from lowest to highest. This makes it easy to scan your data for outliers. It is nice to be able to do these scans in spreadsheets, but we also can do these checks in a programming language like Python or R, or in OpenRefine or SQL.
Exercise
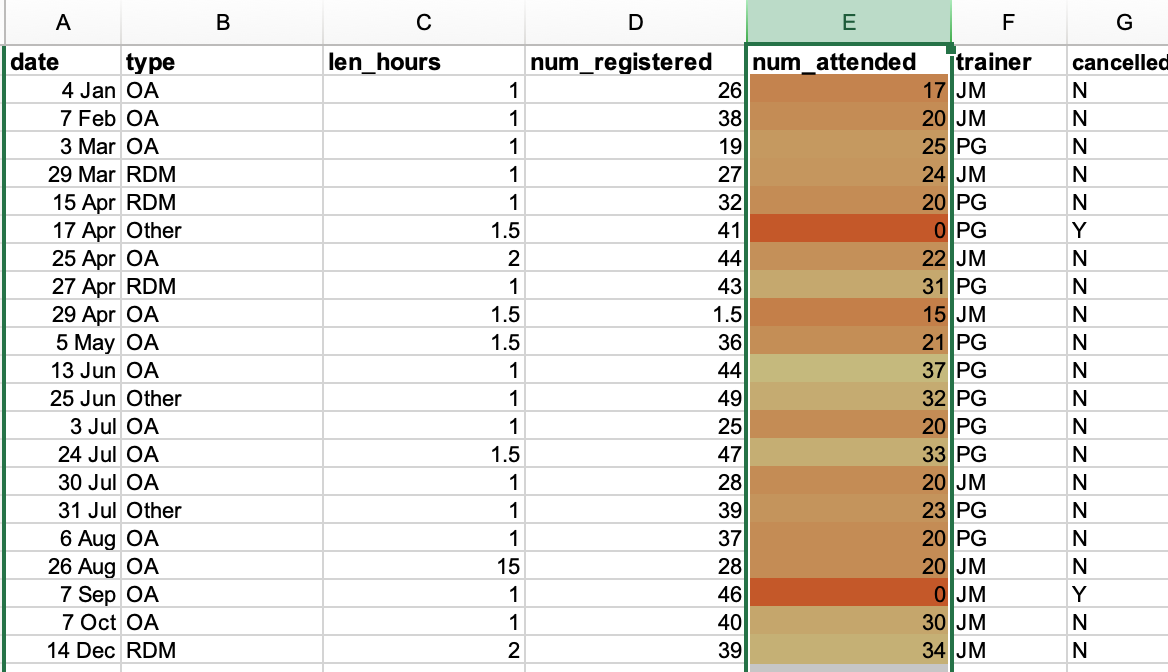
- Make sure the
num_attendedcolumn is highlighted. - Go to Format then Conditional Formatting.
- Apply any 2-Color Scale formatting rule.
- Now we can scan through and different colors will stand out. Do you notice any strange values?
We can now quickly see the two outlier cells with the value of
0 and can also see that these two classes were
canceled.
- Use data validation tools to minimise the possibility of input errors.
- Use sorting and conditional formatting to identify possible errors.
Content from Exporting data from spreadsheets
Last updated on 2023-06-24 | Edit this page
Overview
Questions
- What problems are there with Excel files?
- How can we share data from spreadsheets that is useful for a variety of applications?
Objectives
- Store spreadsheet data in universal file formats.
- Export data from a spreadsheet to a .csv file.
For various reasons, it is not a good idea to store the data you’re
going to work with for your analyses in Excel file formats
(*.xls or *.xlsx - depending on the Excel
version) if you are hoping to preserve the data for the long term.
Why?
-
For one thing, Excel is a proprietary format, and it is possible that in the future, technology won’t exist (or will become sufficiently rare) to make it inconvenient, if not impossible, to open the file.
Think about zipdisks. How many old theses in your lab are “backed up” and stored on zipdisks? Ever wanted to pull out the raw data from one of those? Exactly.
Other spreadsheet software may not be able to open files saved in a proprietary Excel format.
Different versions of Excel may handle data differently, leading to inconsistencies.
As an example, do you remember how we talked about how Excel stores dates earlier? Turns out there are multiple defaults for different versions of the software. And you can switch between them all willy-nilly. So, say you’re compiling Excel-stored data from multiple sources. There’s dates in each file- Excel interprets them as their own internally consistent serial numbers. When you combine the data, Excel will take the serial number from the place you’re importing it from, and interpret it using the rule set for the version of Excel you’re using. Essentially, you could be adding a huge error to your data, and it wouldn’t necessarily be flagged by any data cleaning methods if your ranges overlap.
Storing data in a universal, open, static format will help deal with this problem. Try tab-delimited or CSV (more common). CSV files are plain text files where the columns are separated by commas, hence ‘comma separated variables’ or CSV. The advantage of a CSV over an Excel/SPSS/etc. file is that we can open and read a CSV file using just about any software, including a simple text editor. Data in a CSV can also be easily imported into other formats and environments, such as SQLite and R. We’re not tied to a certain version of a certain expensive program when we work with CSV, so it’s a good format to work with for maximum portability and endurance. Most spreadsheet programs can save to delimited text formats like CSV easily, although they complain and make you feel like you’re doing something wrong along the way.
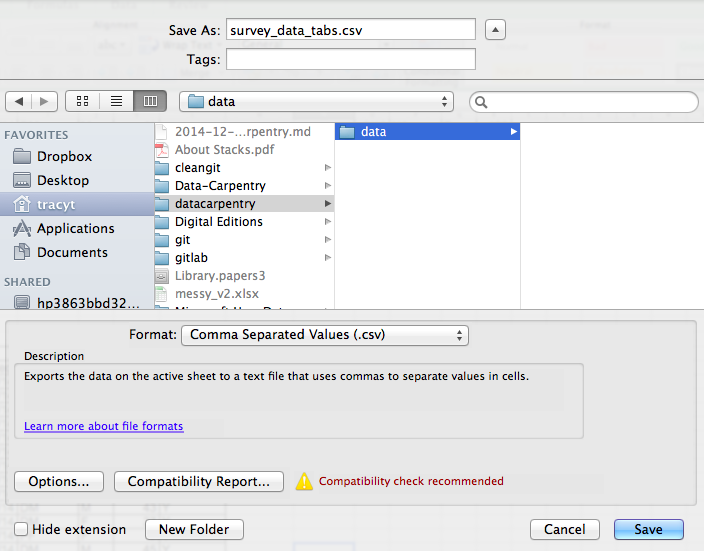
To save a file you have opened in Excel in *.csv
format:
- From the top menu select ‘File’ and ‘Save as’.
- In the ‘Format’ field, from the list, select ‘Comma Separated
Values’ (
*.csv). - Double check the file name and the location where you want to save it and hit ‘Save’.
An important note for backwards compatibility: you can open CSVs in Excel!
A Note on Cross-platform Operability
By default, most coding and statistical environments expect
UNIX-style line endings (ASCII LF character) as
representing line breaks. However, Windows uses an alternate line ending
signifier (ASCII CR LF characters) by default for legacy
compatibility with Teletype-based systems..
As such, when exporting to CSV using Excel, your data in text format will look like this:
data1,data2<CR><LF>1,2<CR><LF>4,5<CR><LF>When opening your CSV file in Excel again, it will parse it as follows:
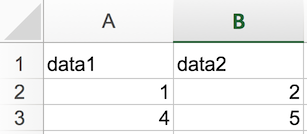
However, if you open your CSV file on a different system that does
not parse the CR character it will interpret your CSV file
differently:
Your data in text format then look like this:
data1,data2<CR>
1,2<CR>
…
You will then see a weird character or possibly the string
CR or \r:
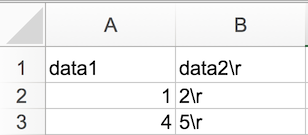
thus causing terrible things to happen to your data. For example,
2\r is not a valid integer, and thus will throw an error
(if you’re lucky) when you attempt to operate on it in R or Python. Note
that this happens on Excel for macOS as well as Windows, due to legacy
Windows compatibility.
There are a handful of solutions for enforcing uniform UNIX-style line endings on your exported CSVs:
When exporting from Excel, save as a “Windows comma separated (.csv)” file
If you store your data file under version control (which you should be doing!) using Git, edit the
.git/configfile in your repository to automatically translate\r\nline endings into\n. Add the following to the file (see the detailed tutorial):
[filter "cr"]
clean = LC_CTYPE=C awk '{printf(\"%s\\n\", $0)}' | LC_CTYPE=C tr '\\r' '\\n'
smudge = tr '\\n' '\\r'`
and then create a file .gitattributes that contains the
line:
*.csv filter=cr- Use dos2unix (available on OSX, *nix, and Cygwin) on local files to standardize line endings.
A note on Python and xls
There are Python packages that can read xls files (as
well as Google spreadsheets). It is even possible to access different
worksheets in the xls documents.
But
- this equates to replacing a (simple but manual) export to
csvwith additional complexity/dependencies in the data analysis Python code - data formatting best practices STILL apply
- Is there really a good reason why
csv(or similar) is not adequate?
- Use .csv file format for data storage and processing
Content from Caveats of popular data and file formats
Last updated on 2024-10-29 | Edit this page
Overview
Questions
- What do you need to be aware of when exporting data?
Objectives
- Identify problems with using the .csv file format.
- Apply best practices for data cleaning to avoid problems with the .csv file format.
Dealing with commas as part of data values in *.csv
files
In the previous lesson we
discussed how to export Excel file formats into *.csv.
Comma Separated Value files are indeed very useful allowing for easily
exchanging and sharing data.
However, there are some significant problems with this particular format. Quite often the data values themselves may include commas (,). In that case, the software which you use (including Excel) will most likely incorrectly display the data in columns. It is because the commas which are a part of the data values will be interpreted as a delimiter.
Data could look like this:
date,type,len_hours,num_registered,num_attended,trainer,cancelled
29 Apr,OA,1.5,1.5,15,JM,N
3 Mar,OA,60,19,25,PG,N
3 Jul,OA,1,25,20,PG, JM ,N
4 Jan,OA,1,26,17,JM,N
29 Mar,RDM,1,27,24,JM,N
In record 3 Jul,OA,1,25,20,PG, JM ,N the value for
trainer includes a comma for multiple trainers
(PG, JM). If we try to read the above into Excel (or other
spreadsheet programme), we will get something like this:
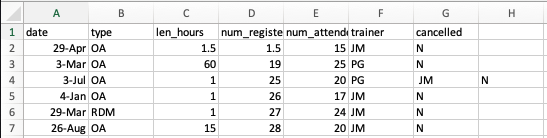
The value for ‘trainer’ was split into two columns (instead of being
put in one column F). This can propagate to a number of
further errors. For example, the “extra” column will be interpreted as a
column with many missing values (and without a proper header!).
If you want to store your data in csv format and expect
that your data values may contain commas, you can avoid the problem
discussed above by putting the values to be included in the same column
in quotes (““). Applying this rule, the data might look like this:
date,type,len_hours,num_registered,num_attended,trainer,cancelled
29 Apr,OA,1.5,1.5,15,JM,N
3 Mar,OA,60,19,25,PG,N
3 Jul,OA,1,25,20,"PG, JM",N
4 Jan,OA,1,26,17,JM,N
29 Mar,RDM,1,27,24,JM,N
Now opening this file as a csv in Excel will not lead to
an extra column, because Excel will only use commas that fall outside of
quotation marks as delimiting characters. However, if you are working
with an already existing dataset in which the data values are not
included in “” but which have commas as both delimiters and parts of
data values, you are potentially facing a major problem with data
cleaning.
If the dataset you’re dealing with contains hundreds or thousands of records, cleaning them up manually (by either removing commas from the data values or putting the values into quotes - ““) is not only going to take hours and hours but may potentially end up with you accidentally introducing many errors.
Cleaning up datasets is one of the major problems in many scientific disciplines. The approach almost always depends on the particular context. However, it is a good practice to clean the data in an automated fashion, for example by writing and running a script. The Python and R lessons will give you the basis for developing skills to build relevant scripts.
- Be careful when using commas in values