All Images

Introduction


Understanding Reproducibility


Figure 1
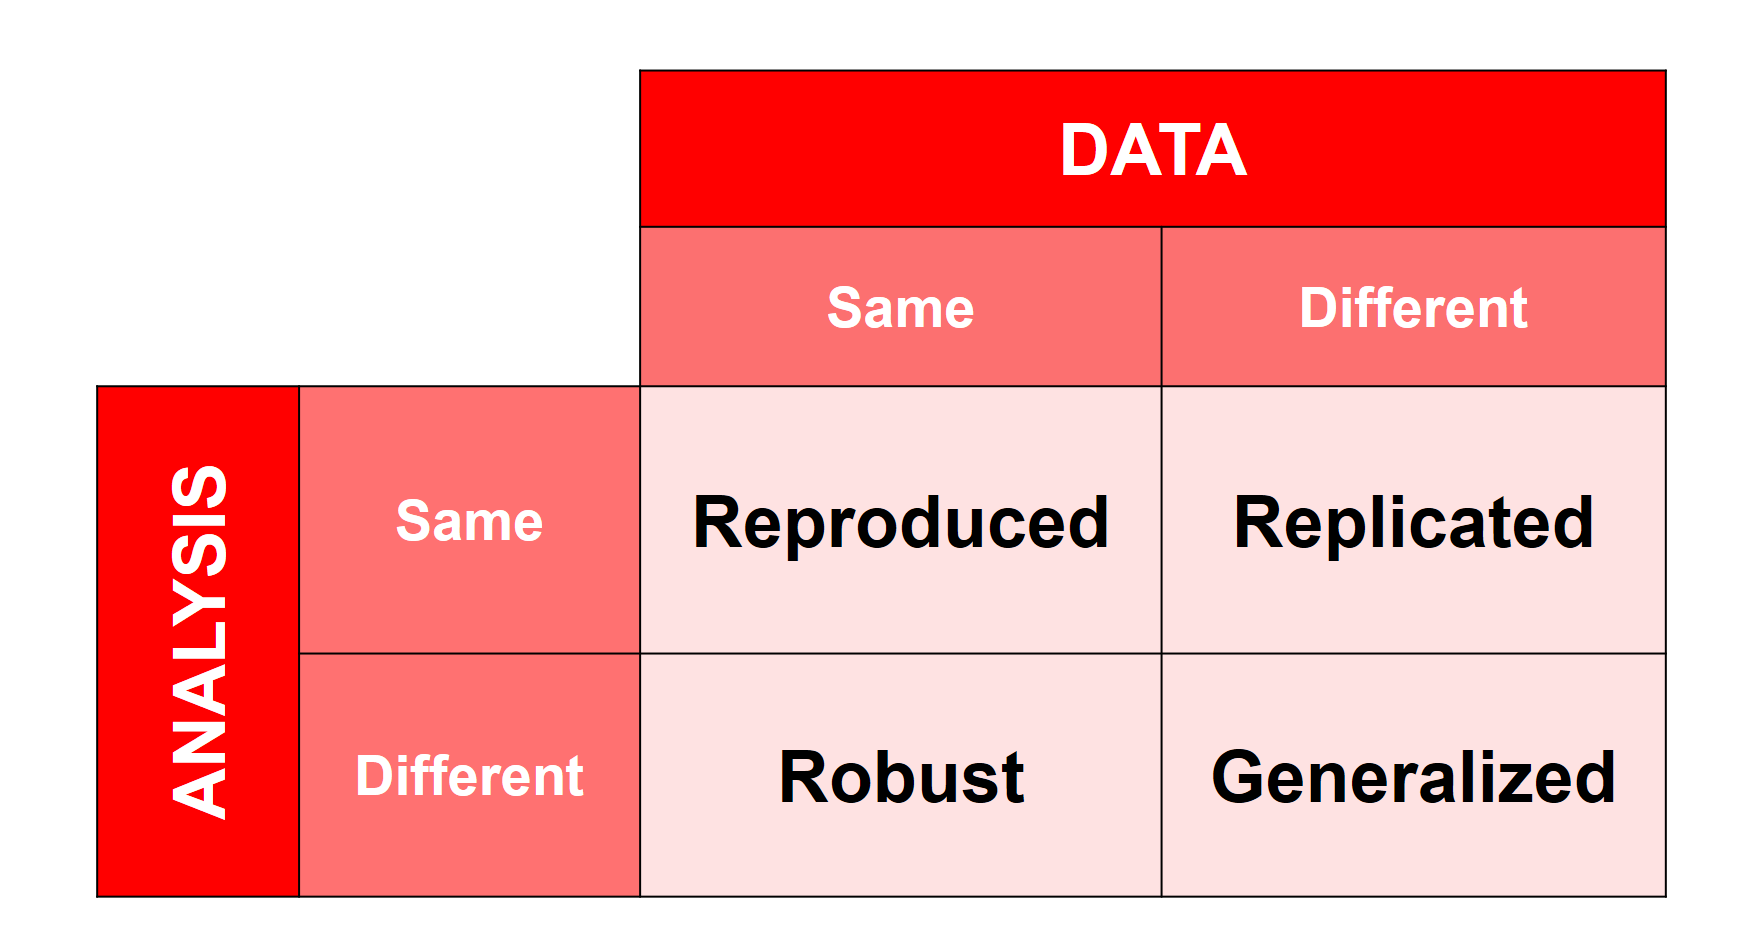
A 2x2 matrix crossing whether the data is the same or different (columns) with whether the analysis is the same or different (rows). Same data and same analysis is labeled Reproduced. Different data and same analysis is labeled Replicated. Same data and different analysis is labeled Robust. Different data and different analysis is labeled Generalized.
2x2 matrix of reproduced, replicated, robust, and generalized results

Making Research Checkable


Figure 1
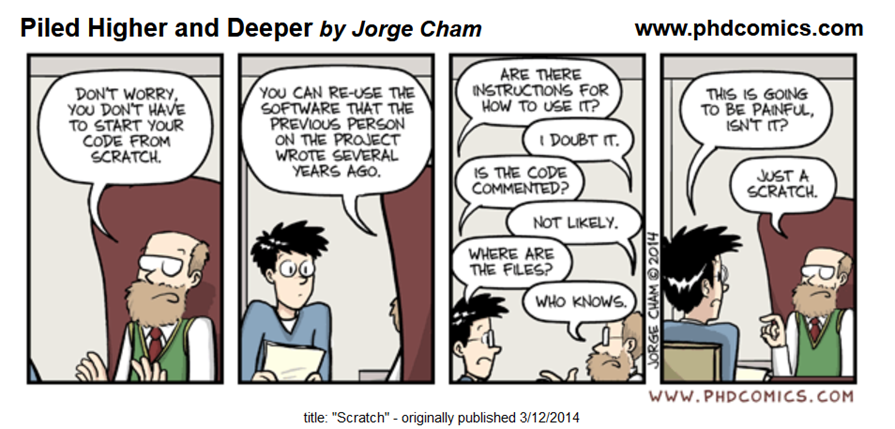
Venn diagram showing that open and reproducible are overlapping but distinct categories of research practice
Venn diagram: open and reproducible research overlap but are distinct

Benefits and Challenges of Reproducibility


Tools for Reproducible Research Workflows


Figure 1
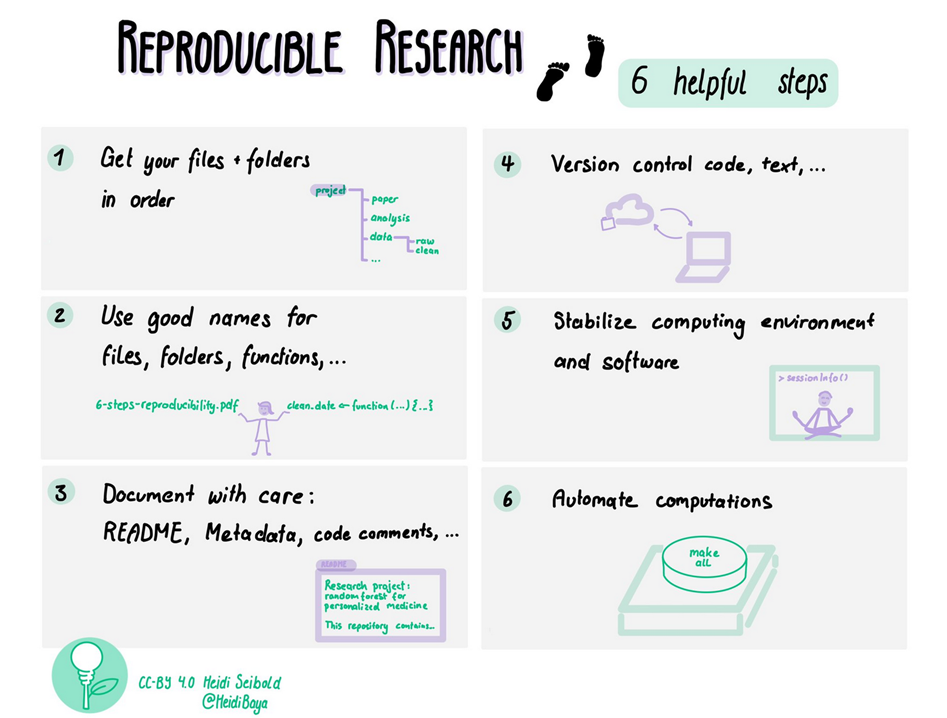
Illustration titled Reproducible Research: 6 helpful steps, showing six numbered practices: 1. get your files and folders in order, 2. use good names for files, folders, and functions, 3. document with care using README files, metadata, and code comments, 4. version control code and text, 5. stabilize the computing environment and software, 6. automate computations. Credit: Heidi Seibold, CC-BY 4.0.
Illustration: Reproducible Research, 6 helpful steps. Credit: Heidi Seibold, CC-BY 4.0.

The Role of Libraries in Supporting Reproducibility