All Images
Image 1 of 1: ‘screenshot of the JupyterLab for launching notebook’
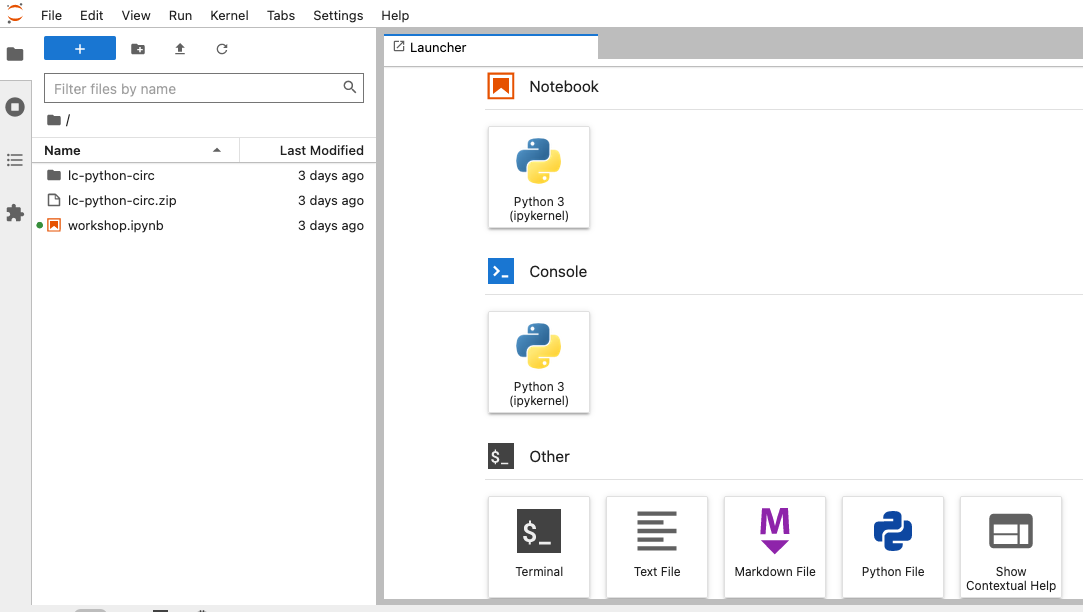
Launching a new Python 3 Notebook
Image 1 of 1: ‘screenshot of the Jupyter notebook dropdown to change a cell to Markdown’
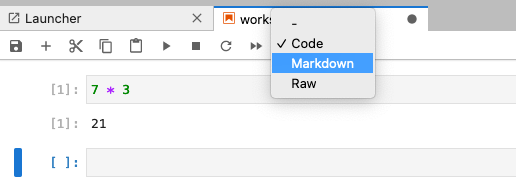
Changing a cell from Code to Markdown
Image 1 of 1: ‘Loop variable 'num' being assigned the value of each element in the list odds in turn and then being printed’
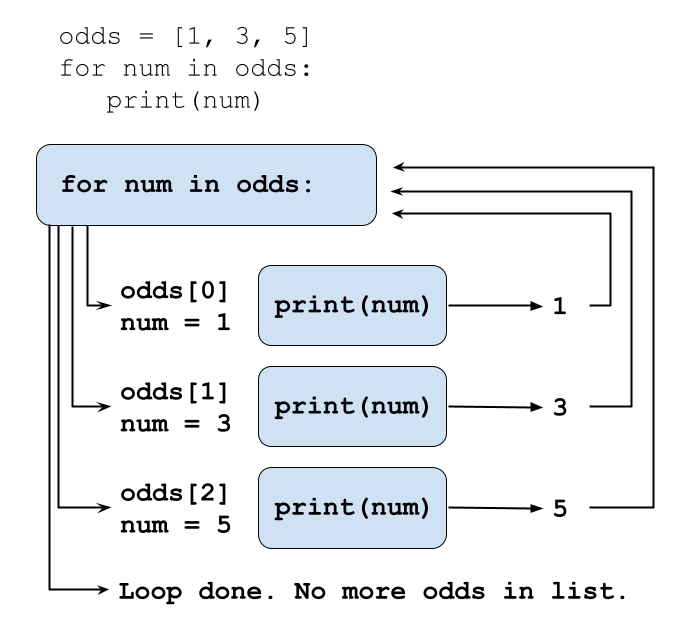
Image 1 of 1: ‘image showing variables in columns, observations in rows, and values in cellssan’
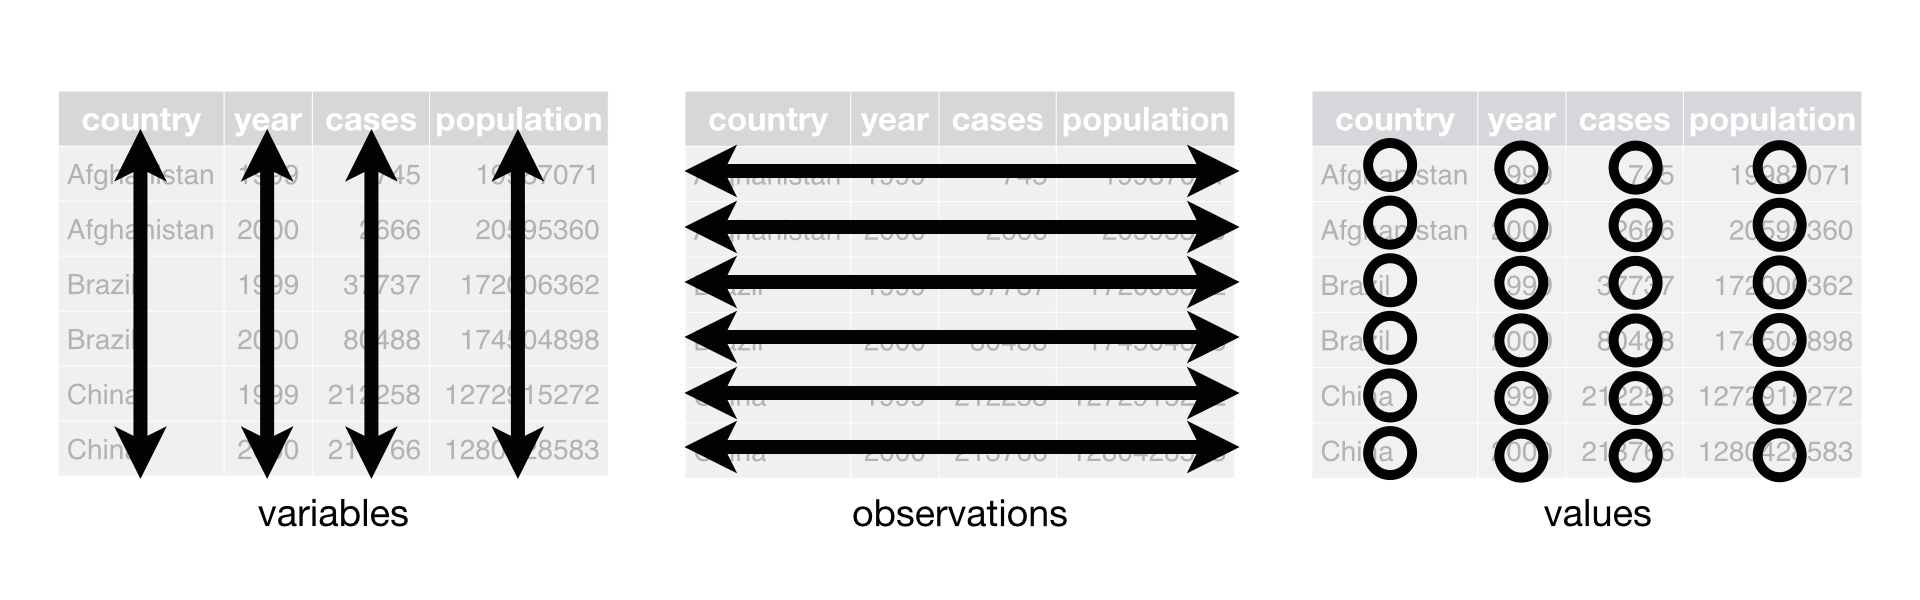
Tidy Data
Image 1 of 1: ‘Line plot of zip code, ytd, year, and circulation numbers over time from the albany DataFrame’
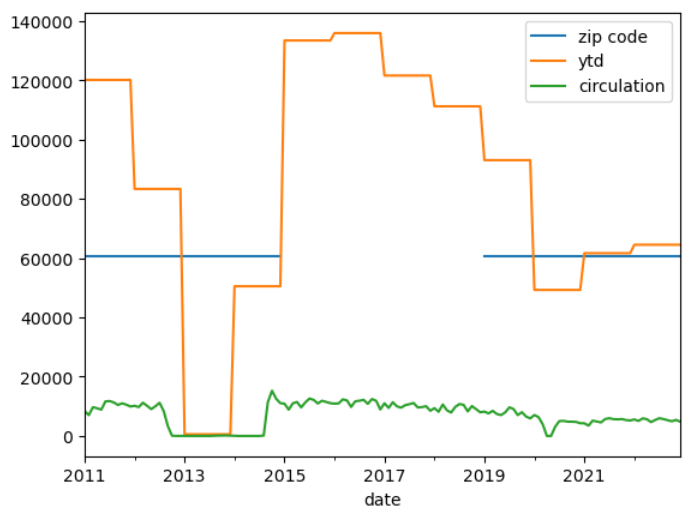
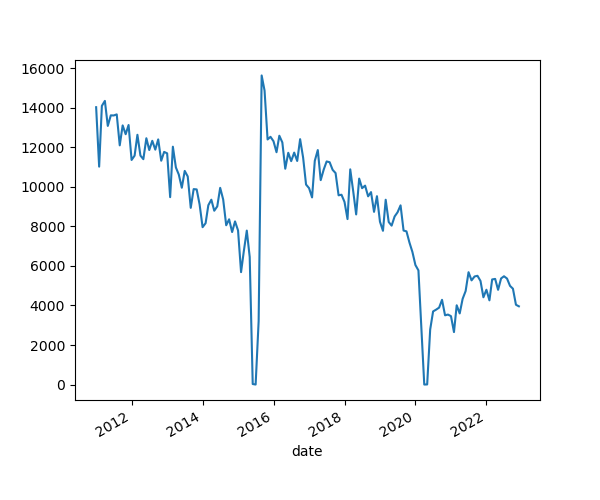
Image 1 of 1: ‘Line plot of the Albany Park branch circulation showing a big drop from 2013 to 2014.’
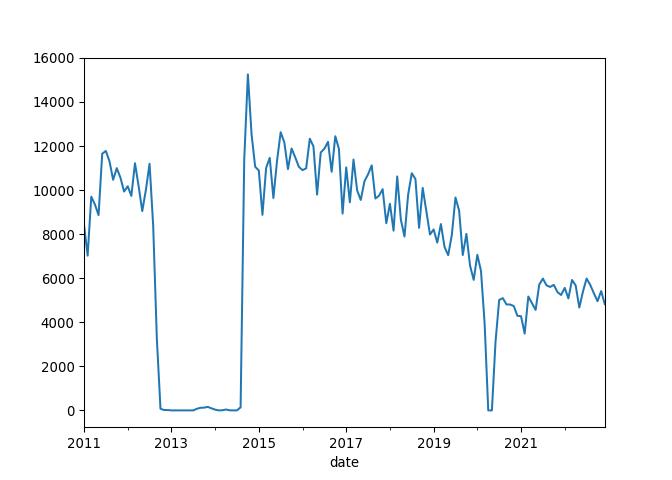
Image 1 of 1: ‘Line plot of the Albany Park branch circulation with matplotlib styles applied.’
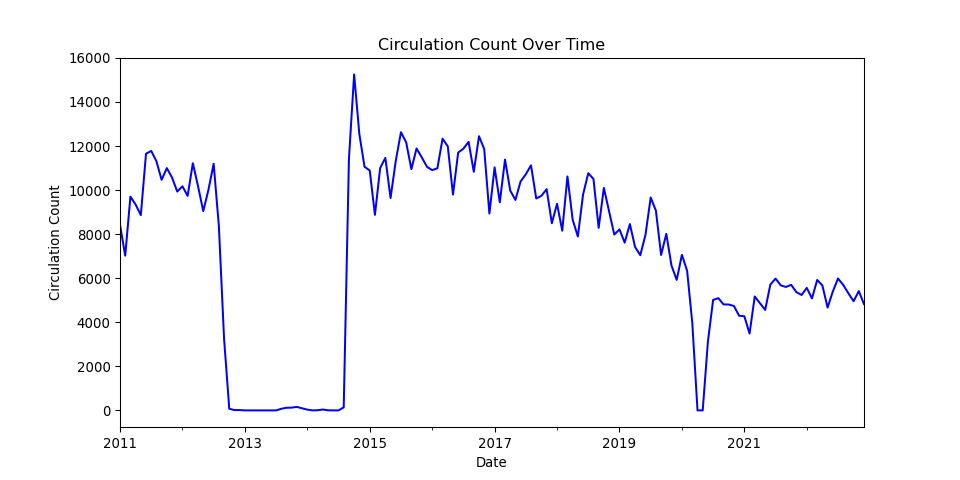
Image 1 of 1: ‘Area plot of the Albany Park branch circulation.’
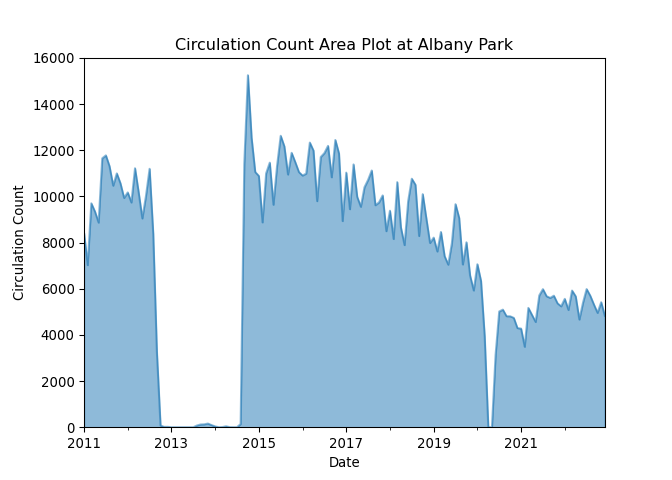
Image 1 of 1: ‘histogram of the Albany branch circulation.’
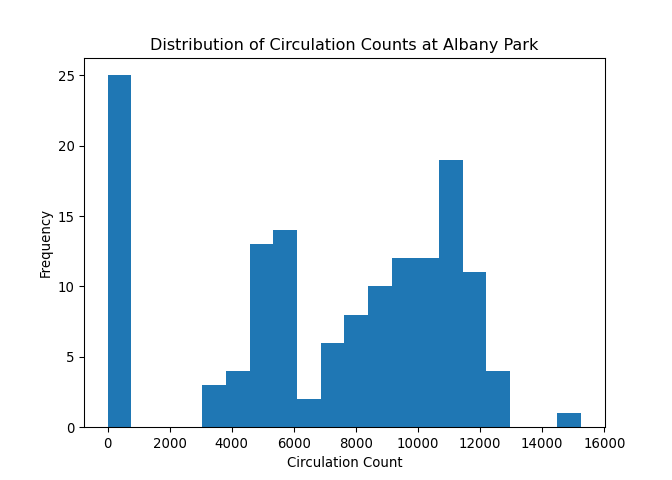
Image 1 of 1: ‘image showing the circulation of the Chinatown branch over ten years’
Chinatown plot
Image 1 of 1: ‘image showing the circulation of the Uptown branch with labels’
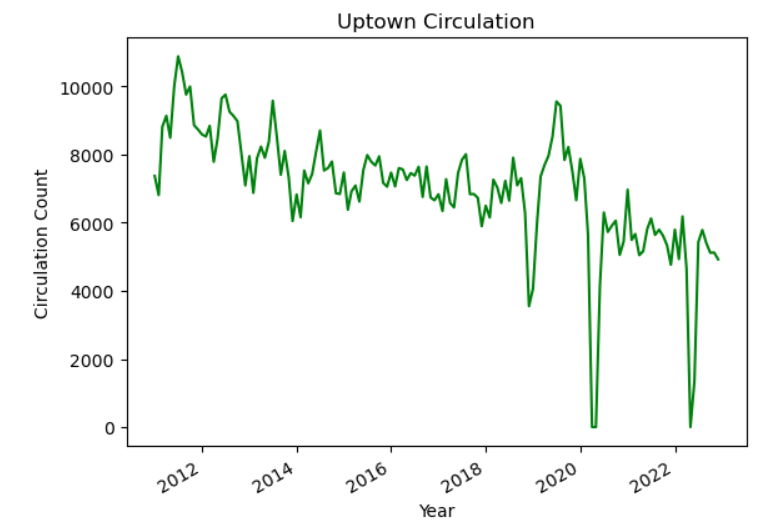
Uptown plot
Image 1 of 1: ‘a bar plot of the top five branch circulation figures’
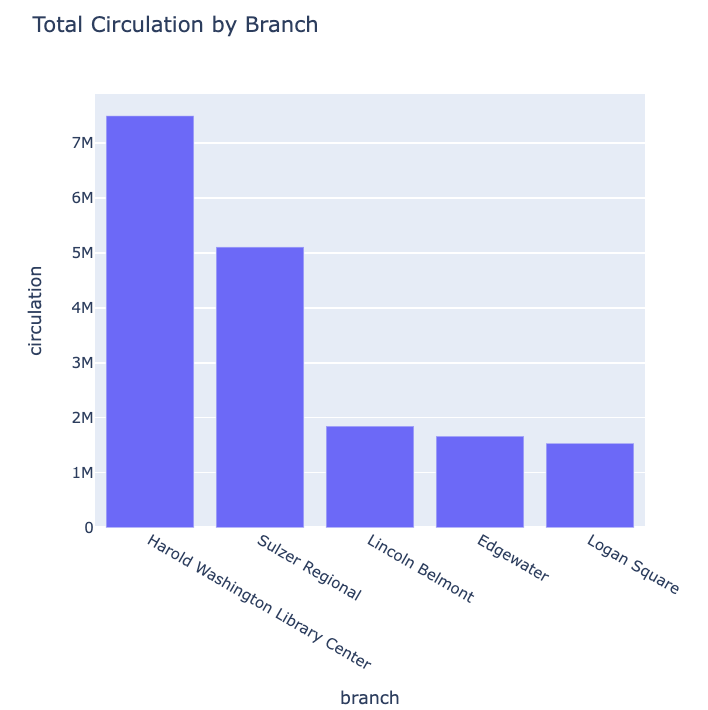
Top five circulation branches